AARON HAGER
I MAKE COOL SHIT
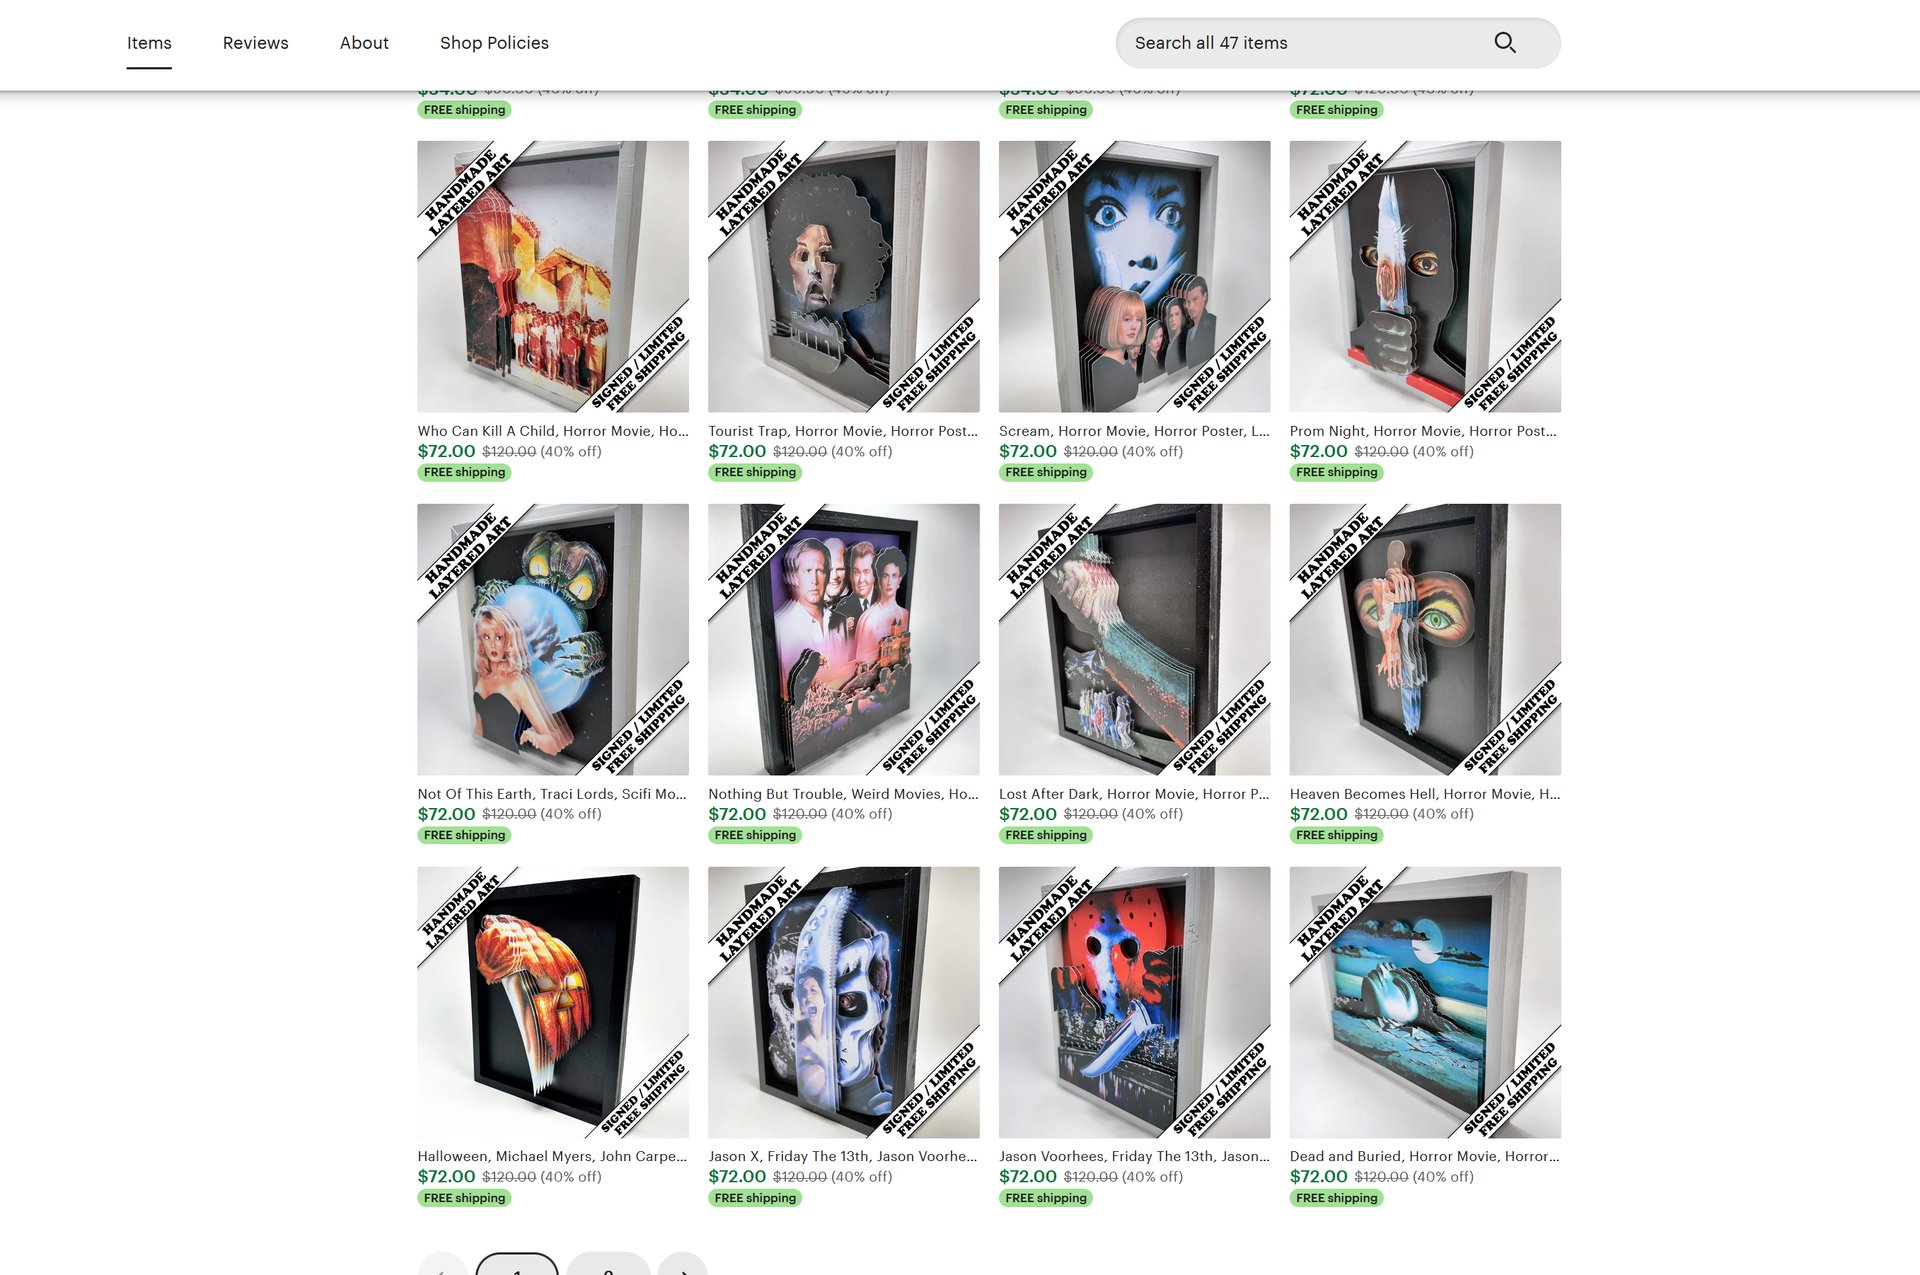
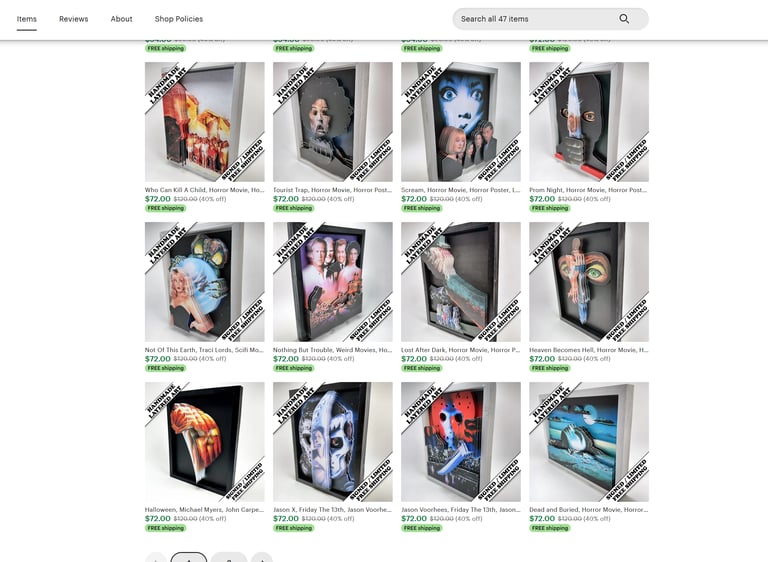
Check out my Etsy shop and buy some cool shit. My pieces make top tier gifts for those that are looking for something truly unique to give to someone.
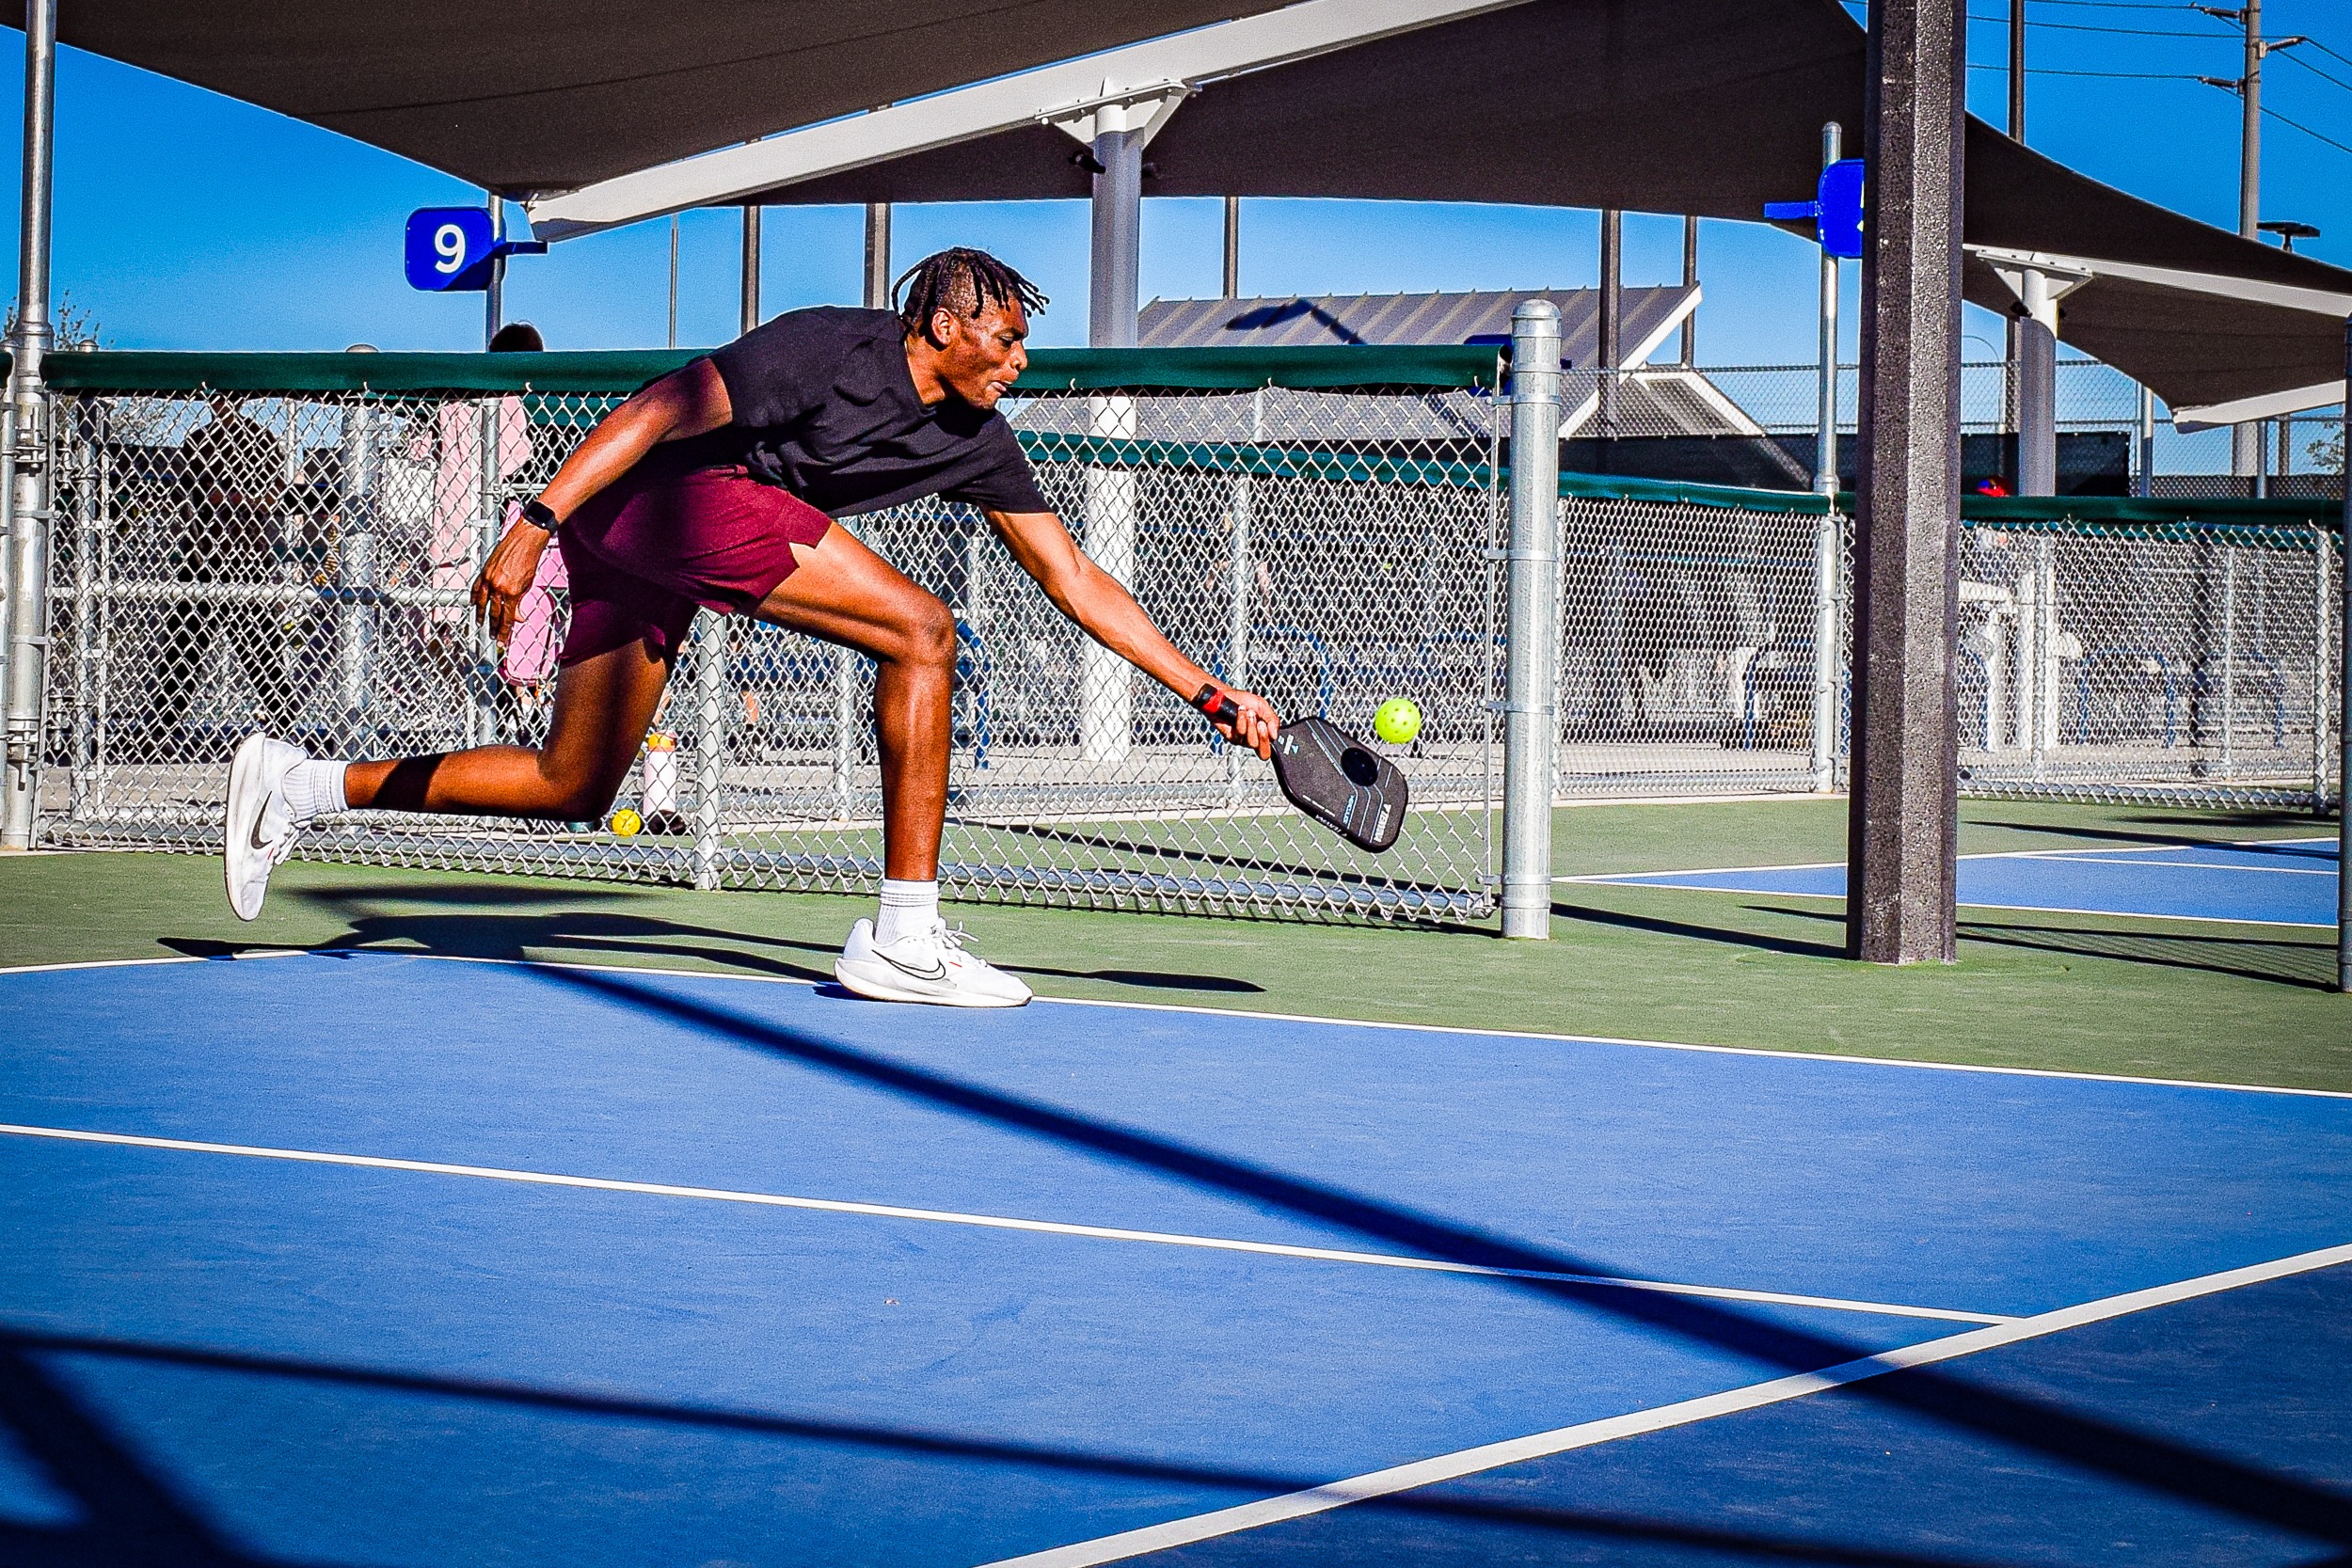
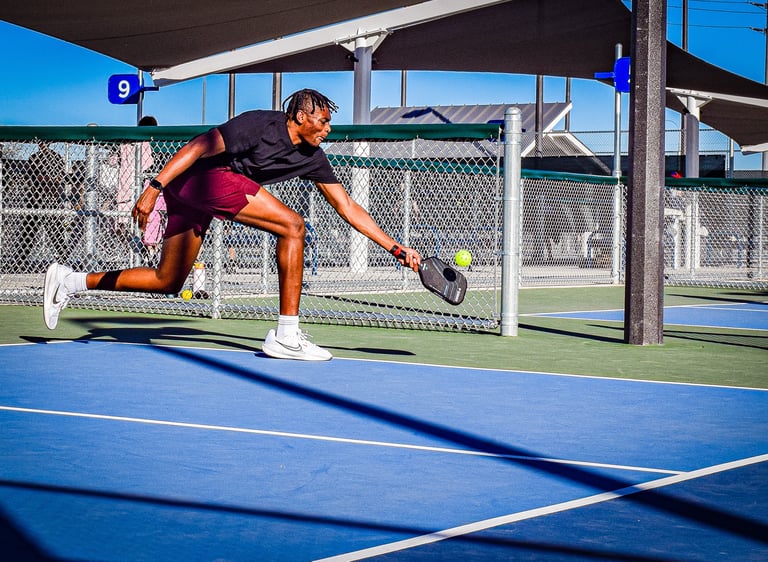
Want pics of you and your friends playing pickleball? $100 for an hour of my time shooting. I will come to whichever courts you like in the Chandler, AZ area. Will travel further but will cost a little more.
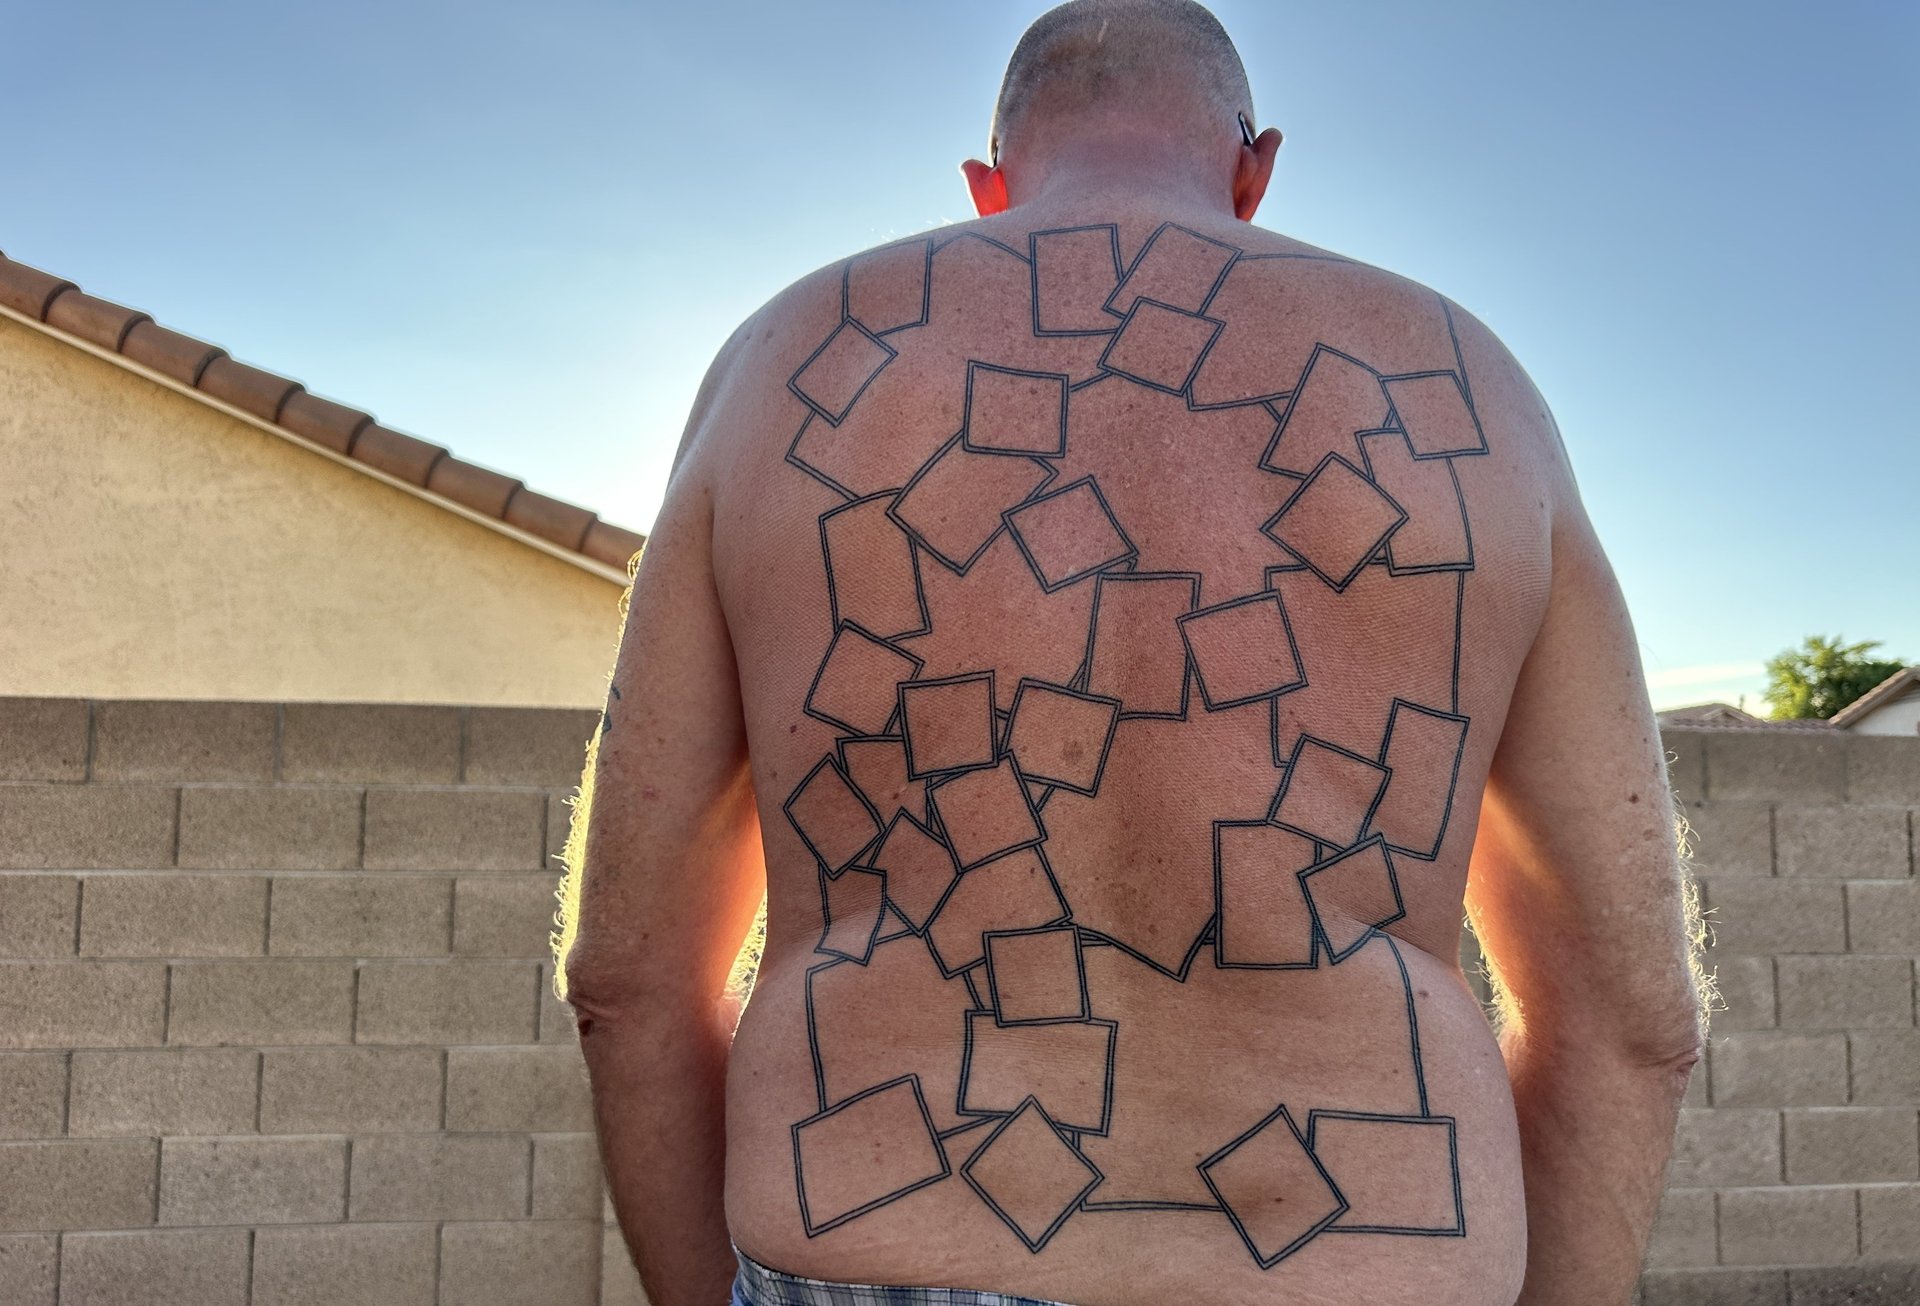
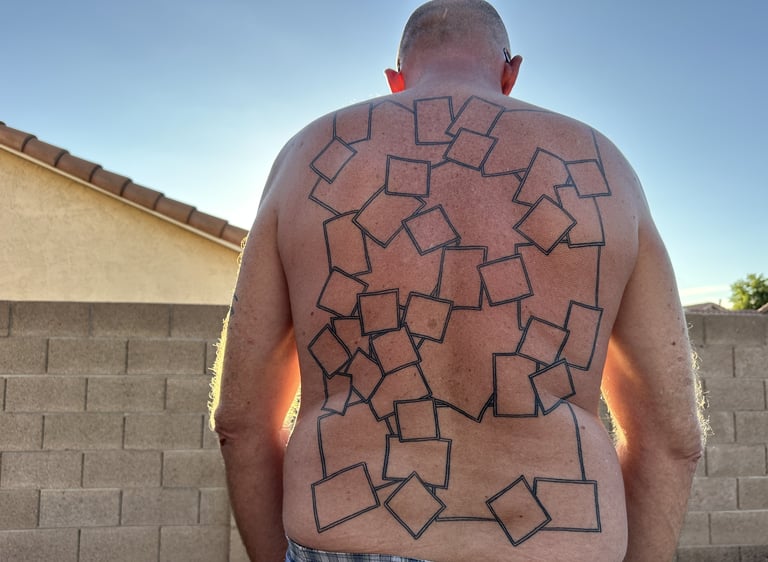
My back tattoo is pretty crazy. A work in progress that will probably take years to complete. If you are looking to be a part of my back gallery lets talk.

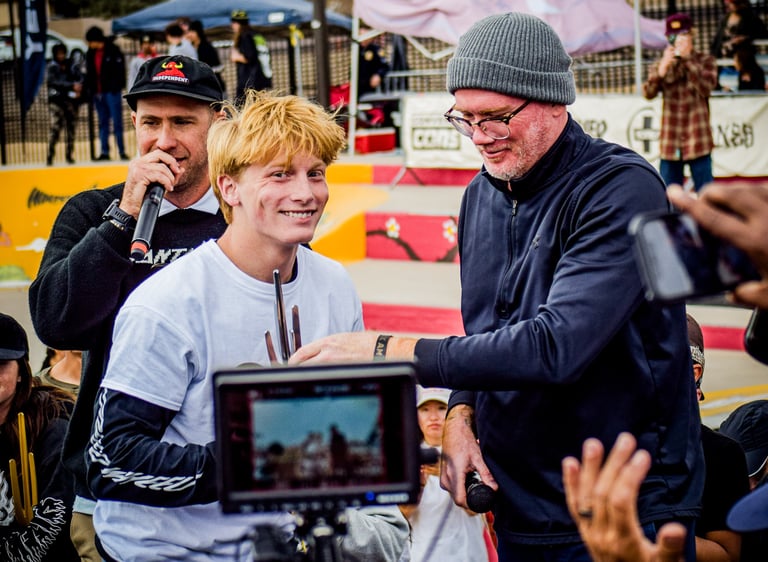
I take pretty sick skateboarding photos. Available to shoot personally or for events. Prices vary.